

Tompkins Example
This section illustrates the construction algorithm for hexagonal adjacency graphs that has been implemented in the SPIRAL program.
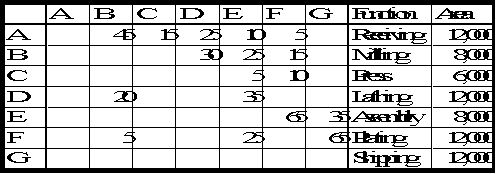
Consider a layout project with seven departments. The space requirements and the flow from-to-chart are given below. The flow chart is based on the number of trips per day with an electric platform truck. This example was originally presented in Tompkins and Moore (1978).
Table 4.1. Departmental Data

The first step converts the asymmetric matrix into a symmetric one. The sum of all relationships is equal to 435.
Table 4.2. Symmetric Department Relationship Data
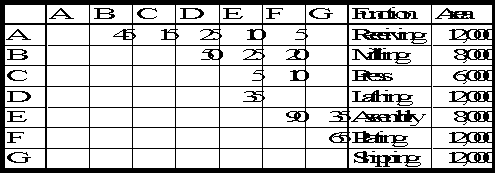
Step two creates the SPIRAL relationships, which in this case is easy since there are no outside relationships, and step three ranks the relationships by non-increasing value.
Table 4.3. Ranked Relationships
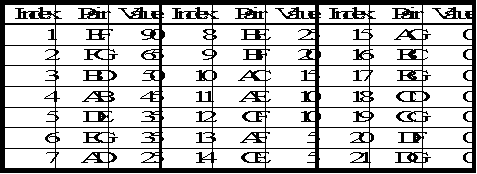
In step four the departments are placed in the relationship diagram in such way as to maximize the sum of adjacent flows.
The flow EF is the largest, hence departments E and F are placed next to each other.
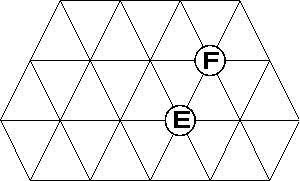
Figure 4.7. Partial Hexagonal Adjacency Graph with 2 Departments
The largest relationship with an anchor department already located is now FG. Department G will be located adjacent to department F, but there exist alternative locations. Department G has both positive flows with departments F and E, so it is placed adjacent to both. There still exists a tie between locations left or right of departments E and F, which is broken arbitrarily.
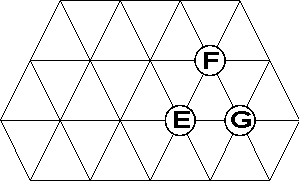
Figure 4.8. Partial Hexagonal Adjacency Graph with 3 Departments
The next largest relationship with a department already in the layout is relationship DE. Department D will be placed adjacent to department E, but there exist alternative locations. Checking down the list shows that department D has no further relationship with any of the already located departments and the tie is thus broken arbitrarily.
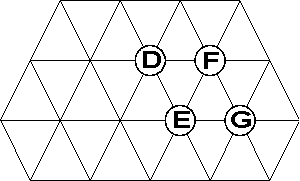
Figure 4.9. Partial Hexagonal Adjacency Graph with 4 Departments
The next largest flow with an already located department is BD. Department B will be placed adjacent to department D. To break the tie, the first located department down the list with a relationship with B is department E. Hence department B will be located in the unique location adjacent to D and E.
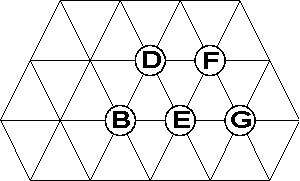
Figure 4.10. Partial Hexagonal Adjacency Graph with 5 Departments
The largest flow is now AB. Department A has positive flows with departments B, D and E in that order. There is a single unique location adjacent to departments B and D, so department A is placed adjacent to departments B and D.
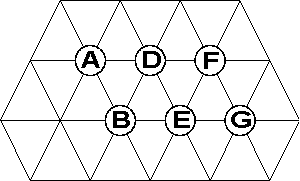
Figure 4.11. Partial Hexagonal Adjacency Graph with 6 Departments
The largest flow is now AC. Department C has positive flows with departments A, F and E. It cannot be adjacent to A and to either F or E, so it is placed in an arbitrary location adjacent to department A.
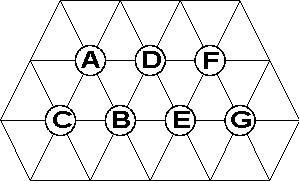
Figure 4.12. Complete SPIRAL Hexagonal Adjacency Graph
Since all the relationships are positive, the evaluation is done immediately with the original adjacency matrix. The adjacency matrix is multiplied element by element with the symmetric relationship matrix to generate the adjacency score.
Table 4.4. Adjacency Matrix
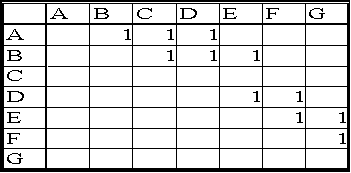
The adjacency score is equal to 385. The efficiency is then equal to 385/435 or 89 %.
If random location ties are broken differently, then the diagram of Figure 4.13 is generated. Its efficiency is equal to 405 / 435 = 93 %.
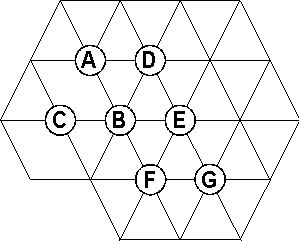
Figure 4.13. Alternative SPIRAL Hexagonal Adjacency Graph
When the layout construction algorithm is executed on the adjacency graph of Figure 4.12 with a level main axis and no improvement steps, then the block layout shown in Figure 4.14 is created.
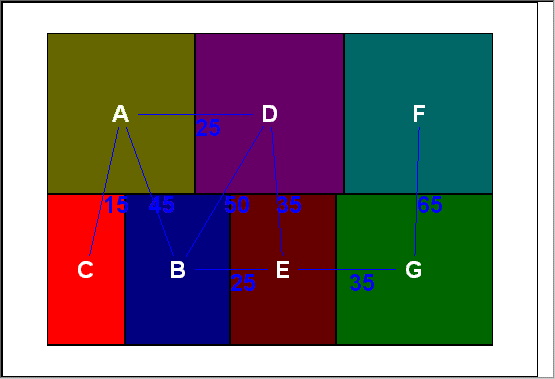
Figure 4.14. SPIRAL Block Layout
The rectilinear centroid-to-centroid distance score is equal to 2171. Since all departments have a shape ratio smaller than their maximum shape ratio, which is equal to two for all departments, the shape adjusted distance score is equal to the flow distance score.
For more information see:
